– Peter Drucker
“What gets measured gets managed — even when it’s pointless to measure and manage it, and even if it harms the purpose of the organization to do so.”
Salesforce can’t help you decide what’s important to measure in your business, but it can help you measure it.
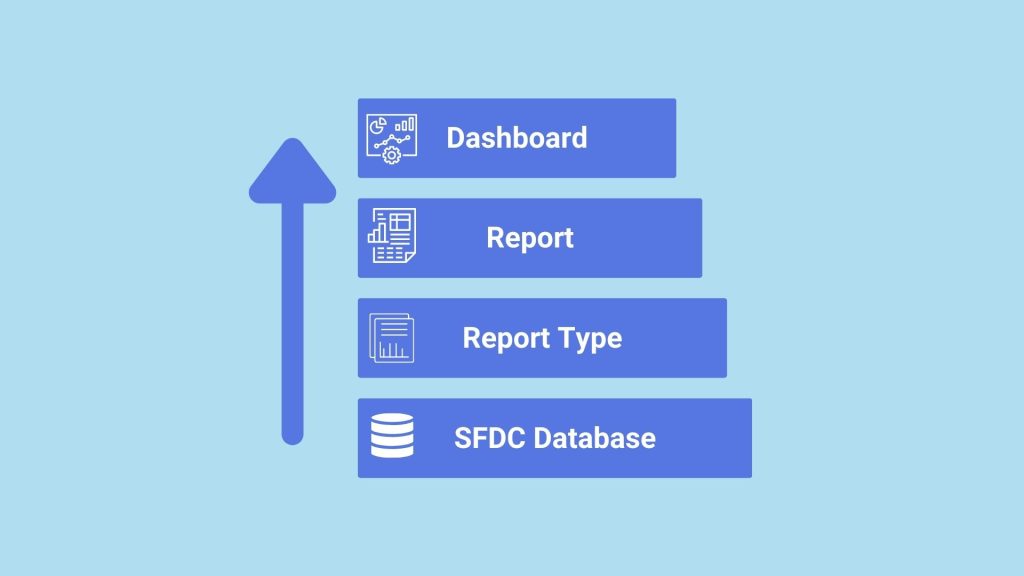
Reporting is one of the Salesforce’s greatest strengths but its not without its challenges. For one, the reporting architecture can be confusing. We put together the image above to show you how the different reporting tools in Salesforce fit together.
You start with your Salesforce database. This contains all your different tables of data, but it’s too much to report on at once. That’s where Report Types come in.
Report Types allow you to select which tables and fields you’d like to pull data from. These tables need to be connected in some way—usually through lookup fields. You can’t create a report type from two unrelated tables. Many people don’t realize that you can create new report types. As your analytics get more sophisticated, you’ll be glad you can.
Then we have tried and true reports. These are dependent on a report type. If you can’t get to the data you want in a report, consider going down a level and choosing a different report type. In reports you’re adding columns and filters to narrow down the data you’re seeing even further.
Finally, we get to dashboards which are made up of reports. When building out dashboards try to use as few reports as possible. You can add a report to a dashboard multiple times and adjust the grouping and visualization without having to create a new report. The fewer reports you have associated with a dashboard, the easier it will be to update and maintain.
Here are a few resources to help you.
- Free Prebuilt Reports and Dashboards – Install this AppExchange Dashboard Pack from Salesforce Labs if you’re looking for something prebuilt to use as a starting point.
- Reporting Tutorials on YouTube – We’ll continue adding to this playlist. Reporting videos continue to be among our most popular.
- Paid Reporting Crash Course – If you’re looking to train someone on Salesforce reporting quickly, consider enrolling them in our crash course.
Thanks for reading!
Brian